Aerodynamics Tab
The Aerodynamics tab shows the static aerodynamic coefficients of the aircraft against the angle of attack. All coefficients use the reference area, mean chord and span of the project, and the moments are taken about the centre of gravity. See Axes and Coefficients.
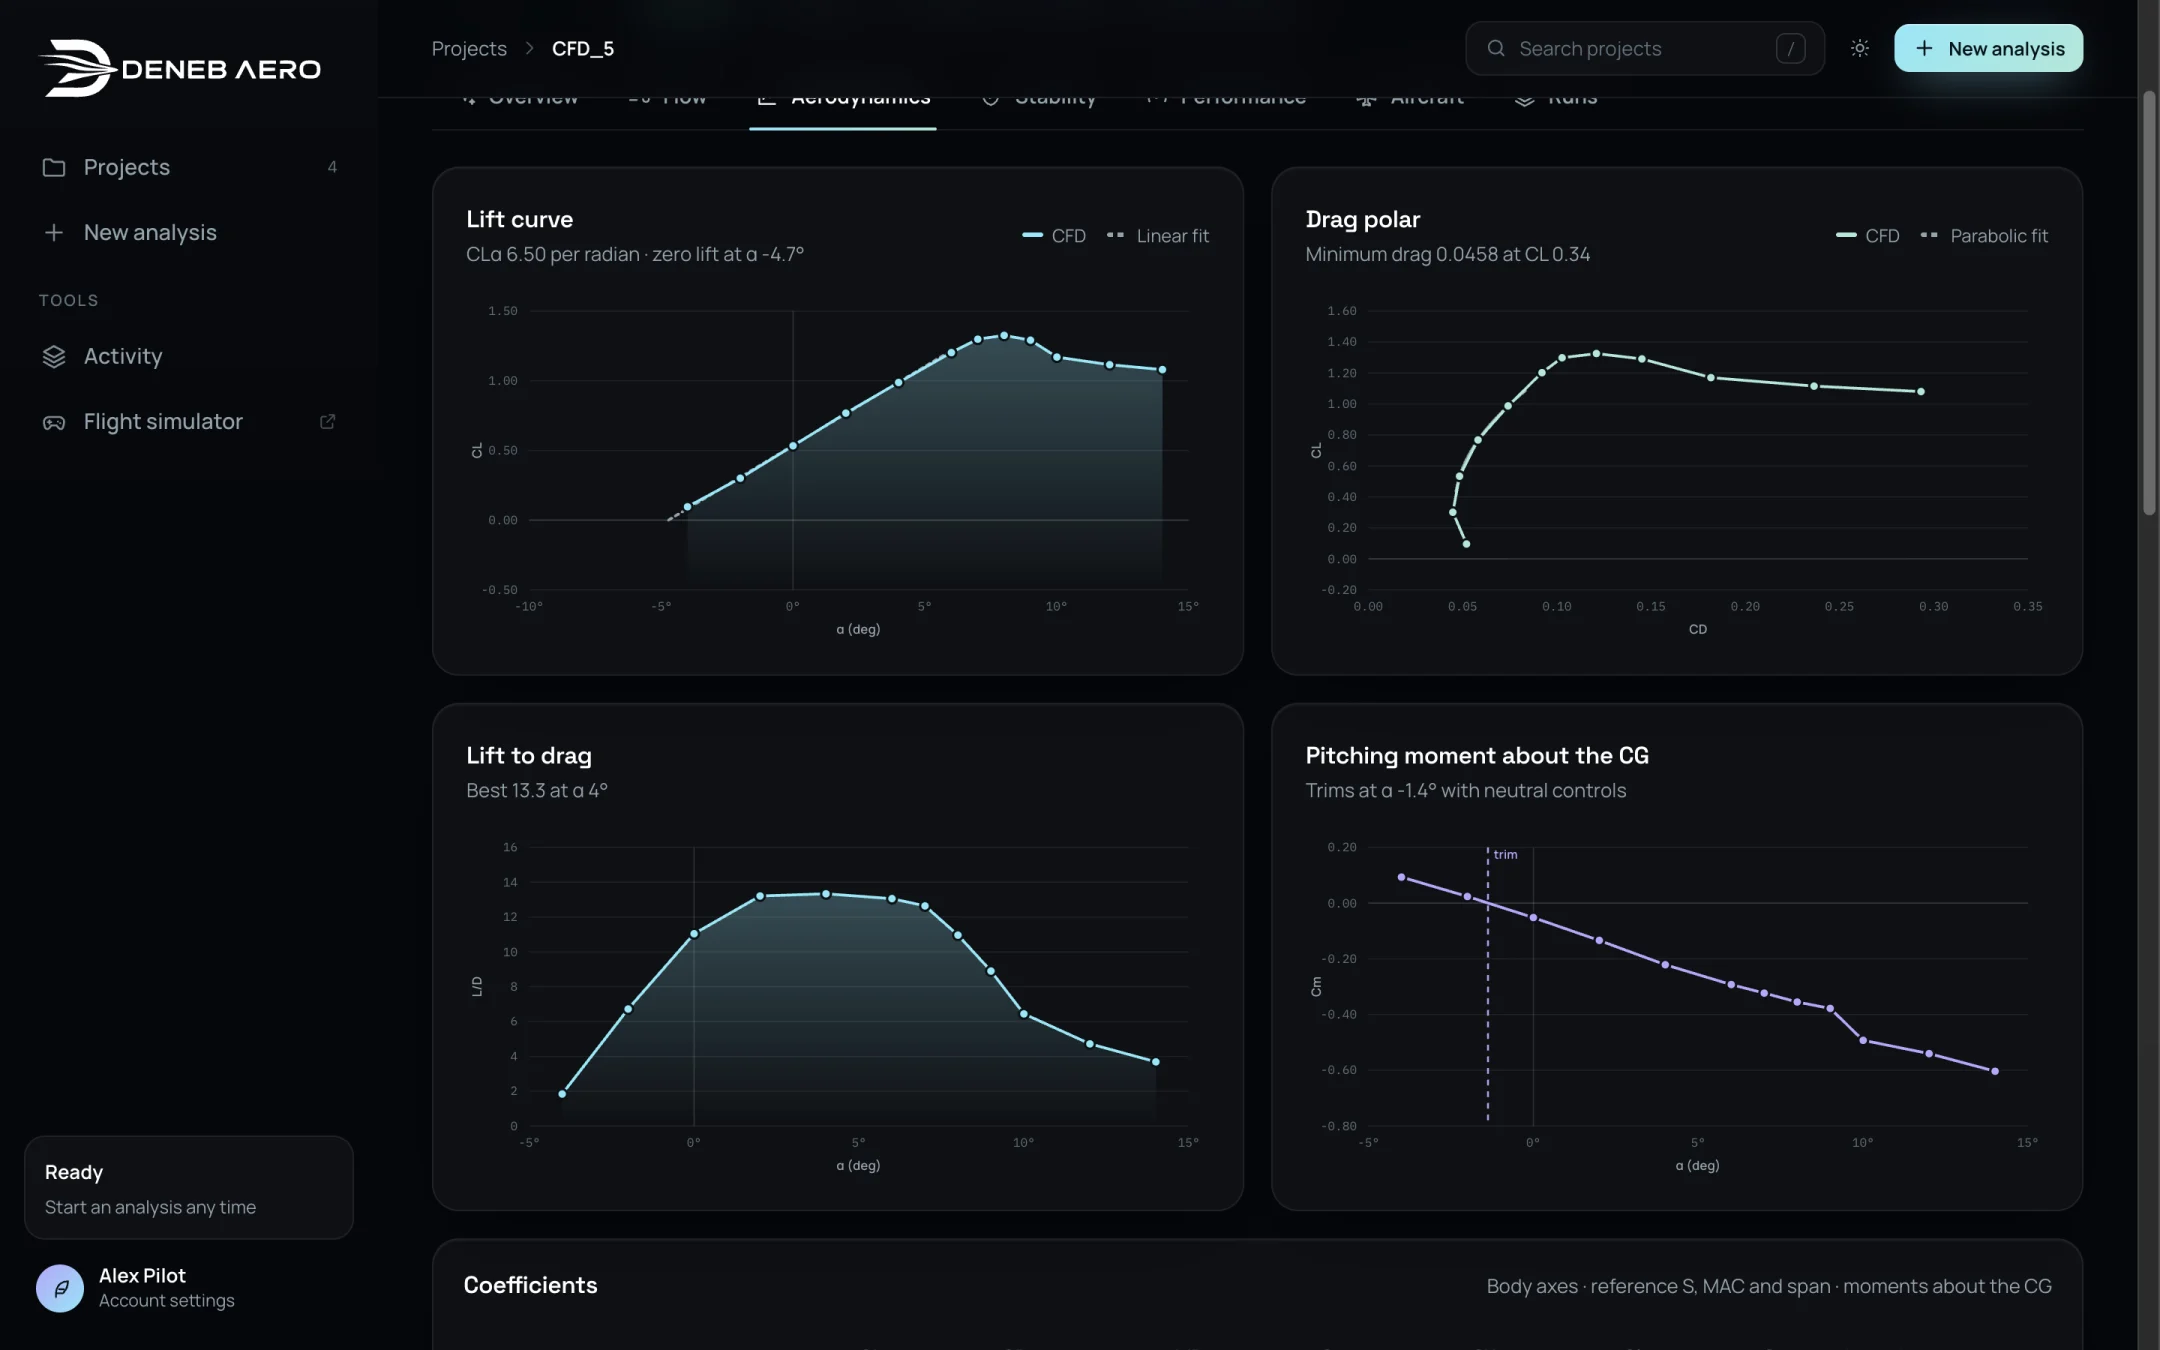
Lift curve, drag polar, lift to drag and pitching moment.
Charts
- Lift curve
CL against α. The points are the CFD runs; the line is a linear fit. The subtitle gives the lift-curve slope CLα per radian and the angle of zero lift, for example CLα 6.50 per radian · zero lift at α −4.7°.
- Drag polar
CL against CD, with a parabolic fit. The subtitle gives the minimum drag and the lift coefficient at which it occurs.
- Lift to drag
L/D against α. The subtitle gives the best value and its angle.
- Pitching moment about the CG
Cm against α. A negative slope means the aircraft is stable in pitch. The vertical line marks the trim angle with neutral controls, where Cm is zero.
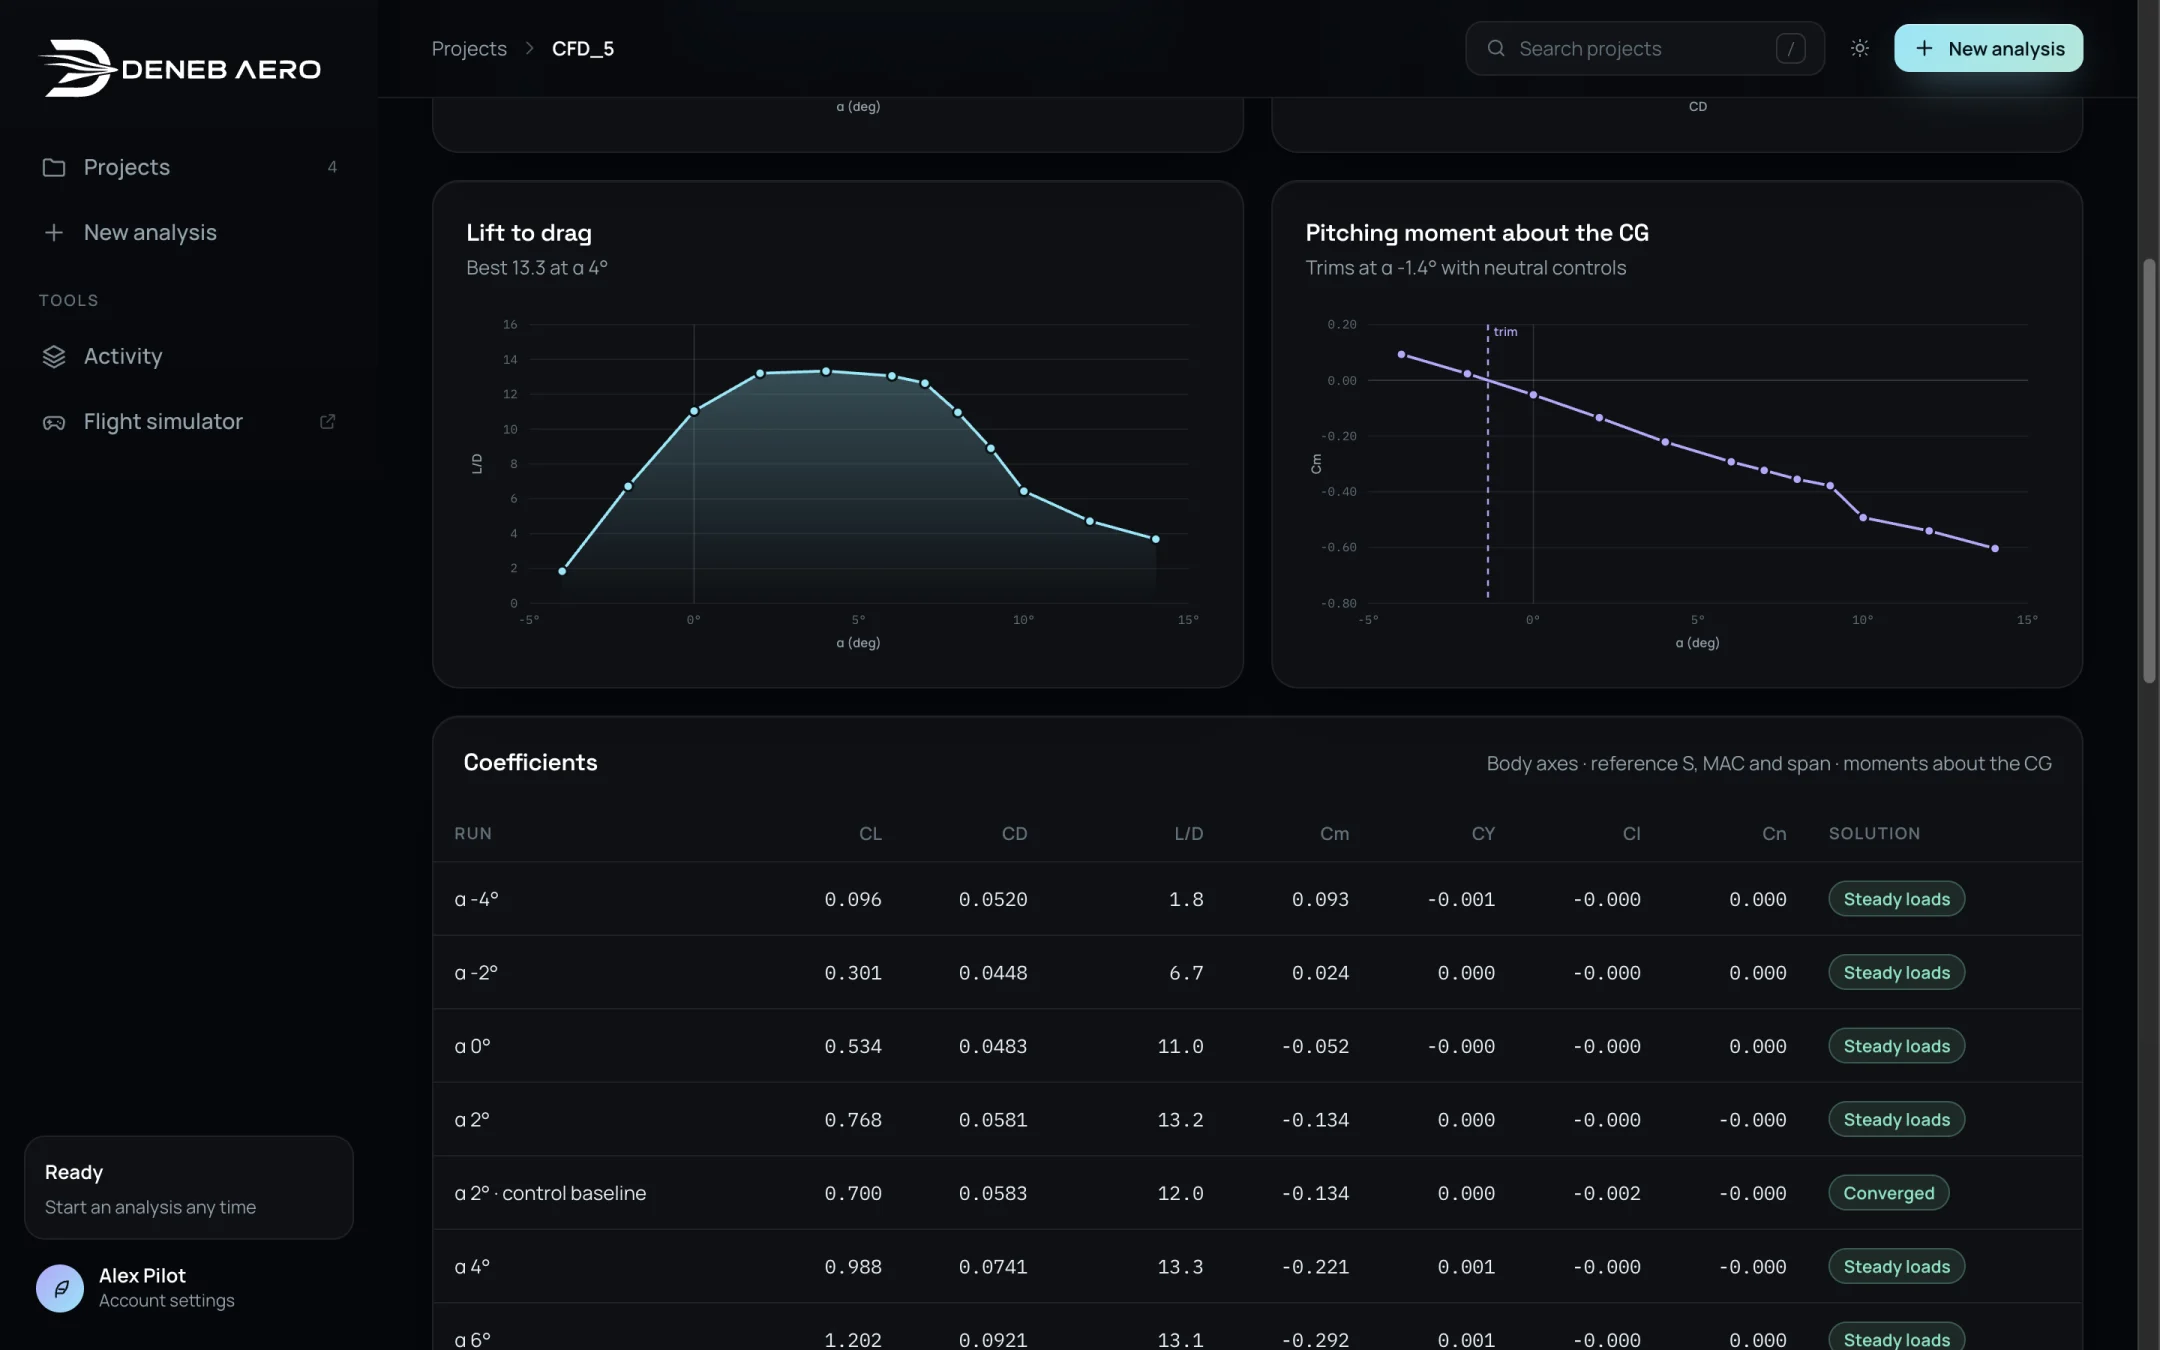
Lift to drag and pitching moment about the CG.
Points from runs that were replaced by a better solution, for example an unsteady run past the stall, are drawn separately so that the replacement can be seen.
Coefficients table
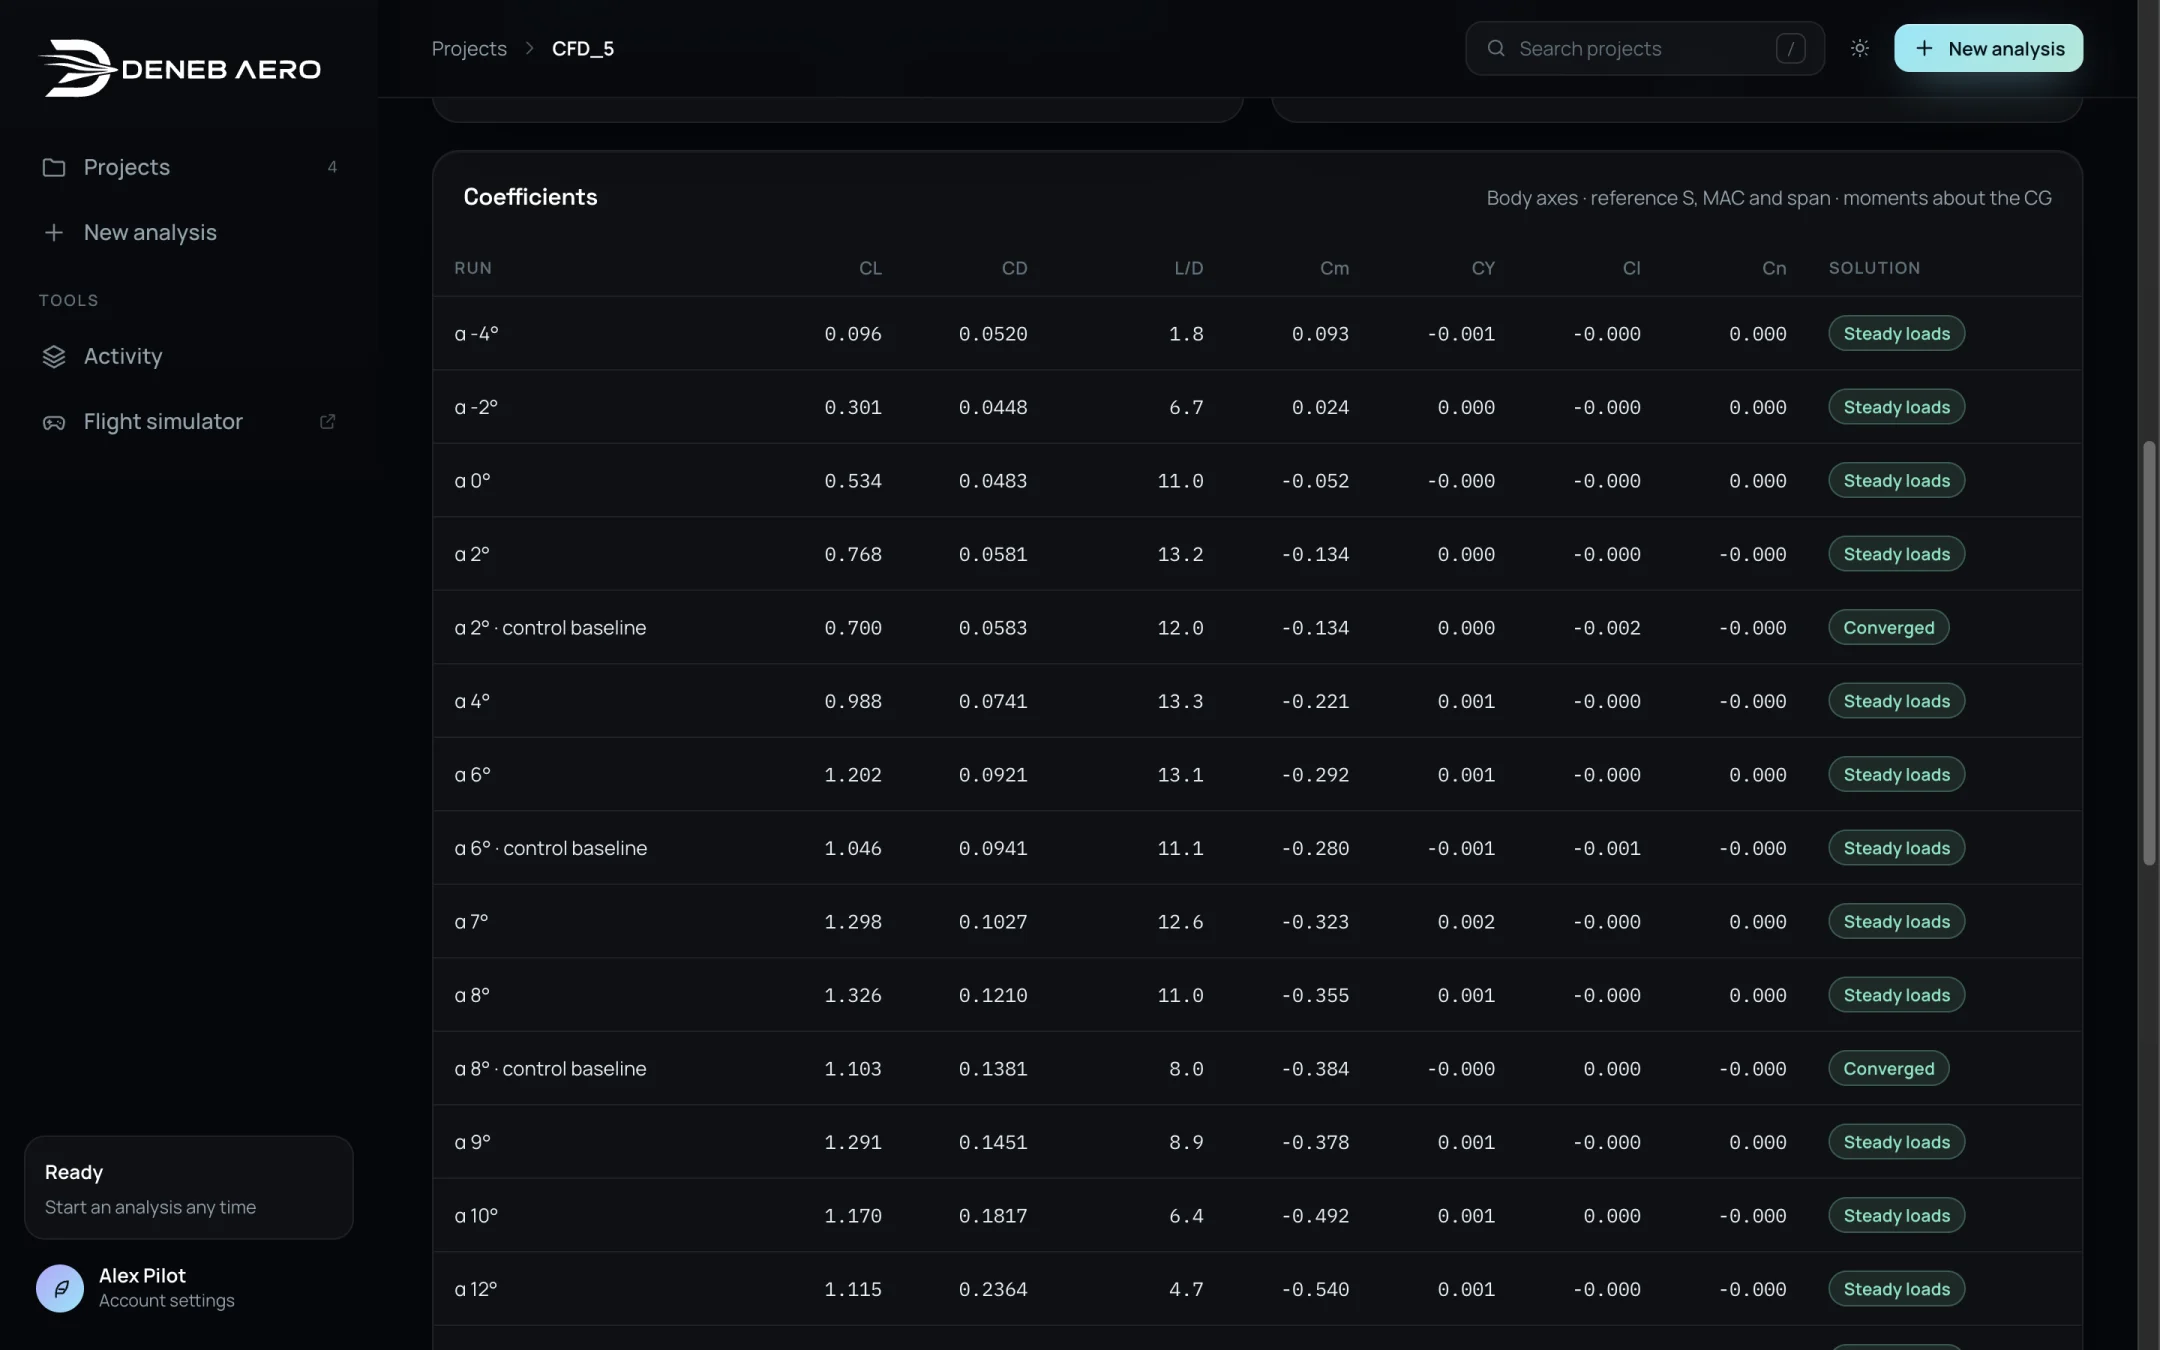
The table of coefficients.
The table lists every run with CL, CD, L/D, Cm, CY, Cl and Cn, and its solution type (Solution Types and Convergence). The axes are body axes, with the reference S, MAC and span, and moments about the CG.
The rows are named after the run, for example:
α 4°— a run of the polar.α 2° · control baseline— the neutral run on the control mesh, from which control increments are measured.α 2° · roll +10°— a control run.α 2° · β 5°— a sideslip run.α 2° · pitch rate— a rotating-frame run for the damping.α 2° · cruise power,α 2° · hover— runs with the propellers turning.
Note
The control baseline runs use a different mesh and turbulence model from the polar, so their values differ a little from the polar run at the same angle. Control effects are always taken as the difference from the baseline on the same mesh.